Advanced Charts, Candlesticks & Market Analytics
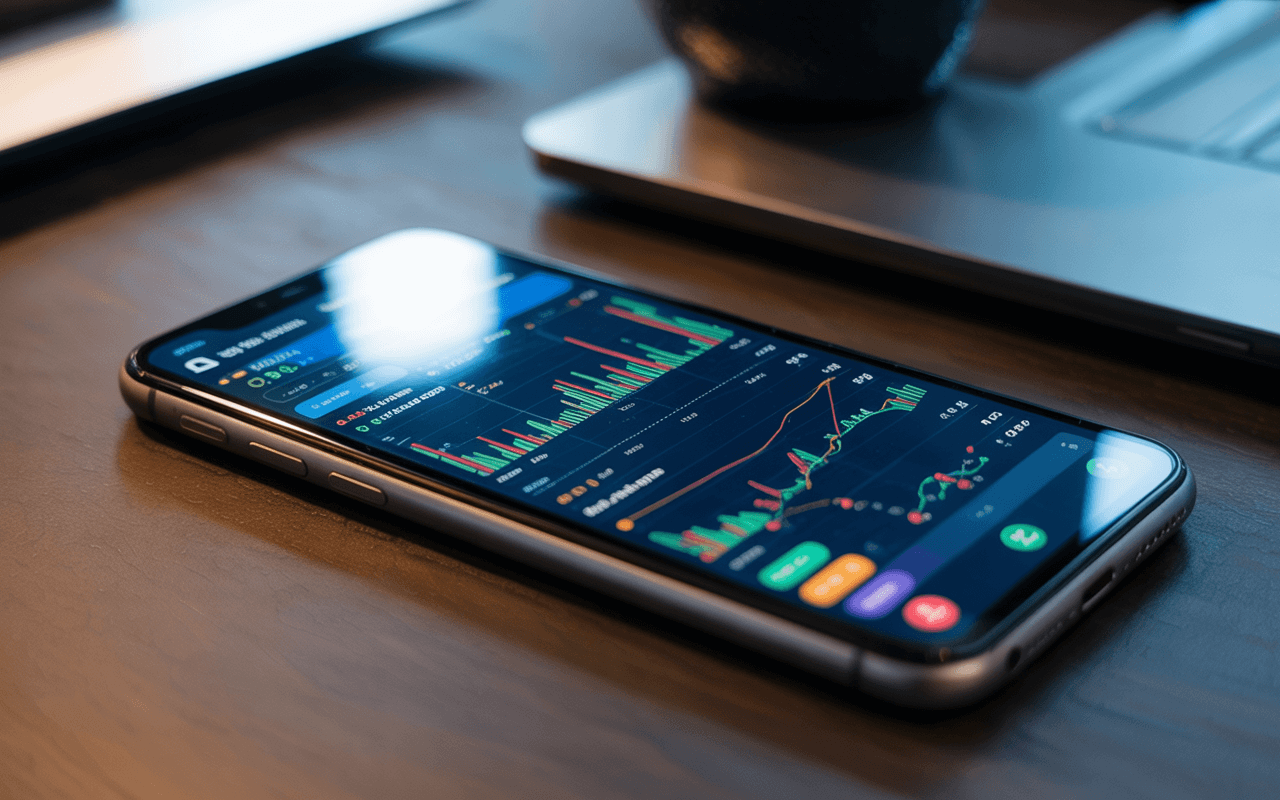
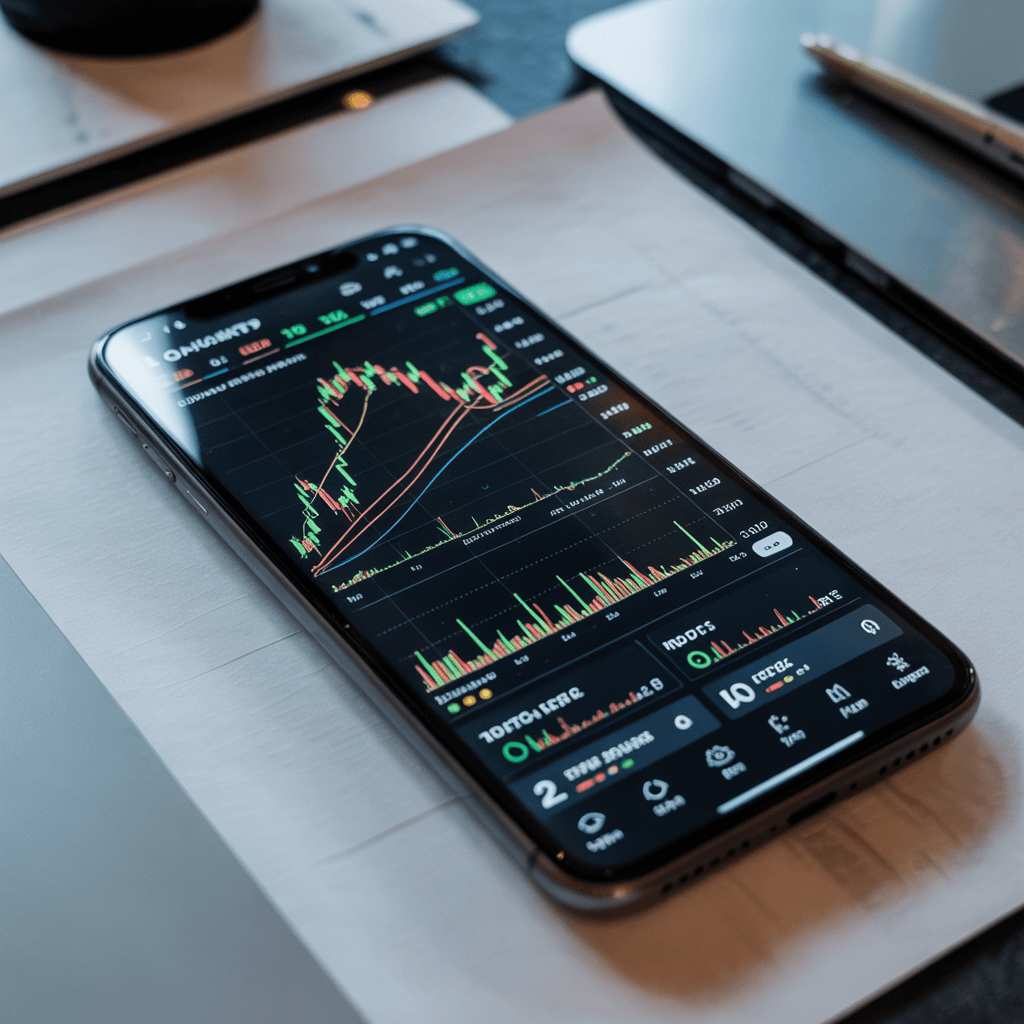
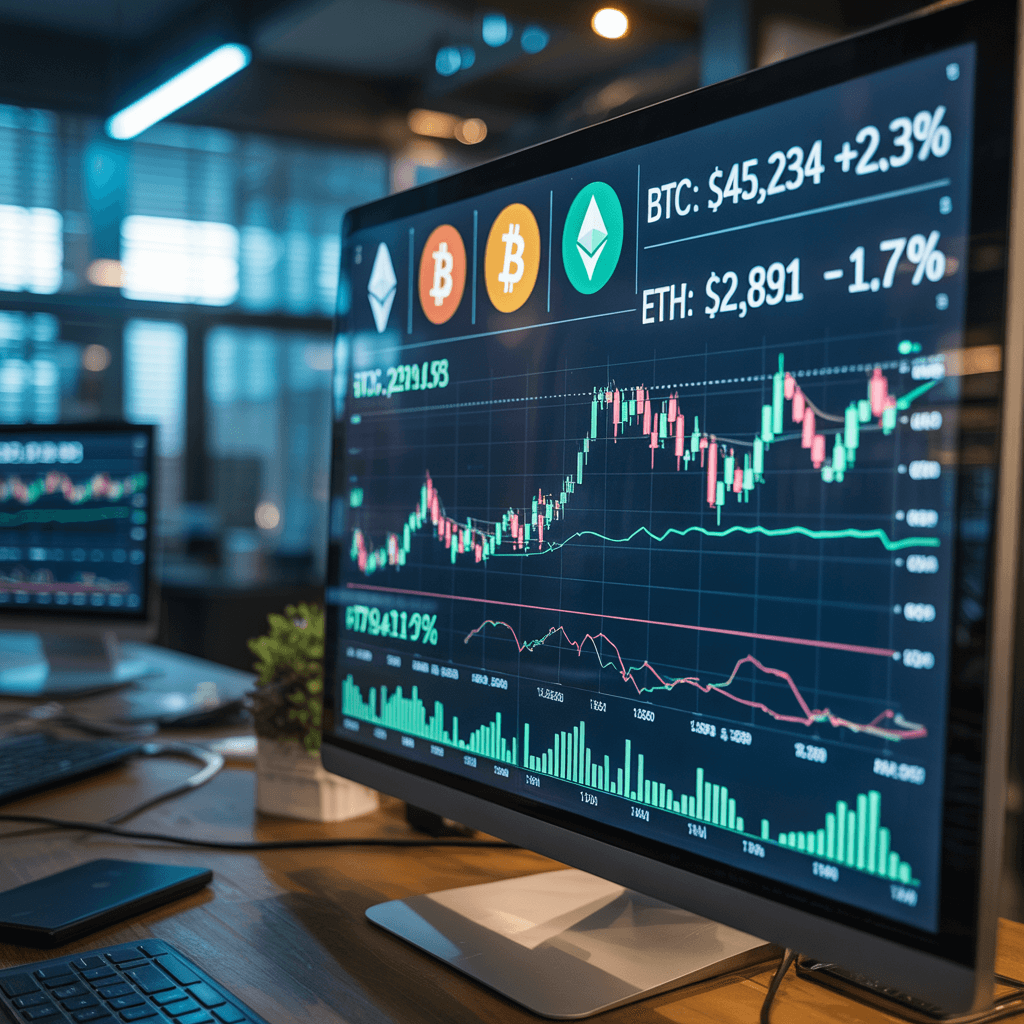
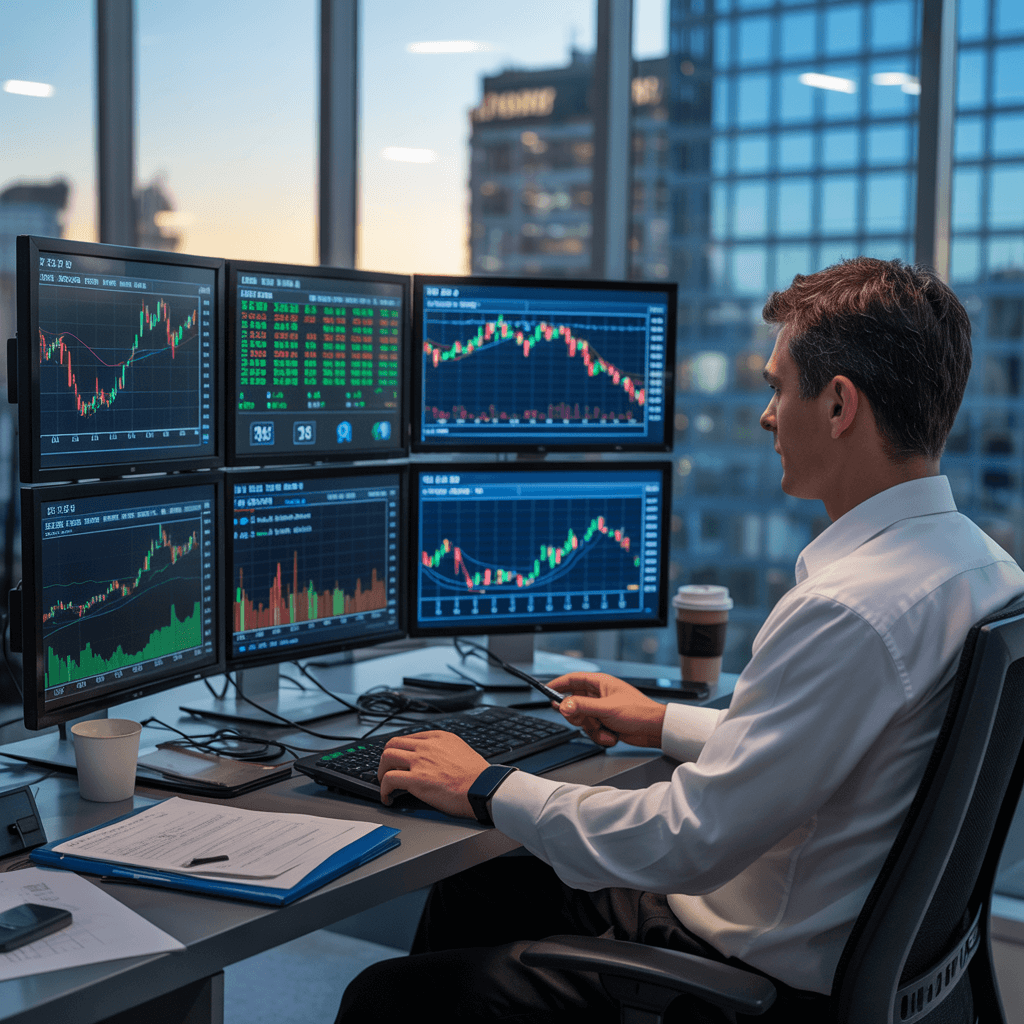
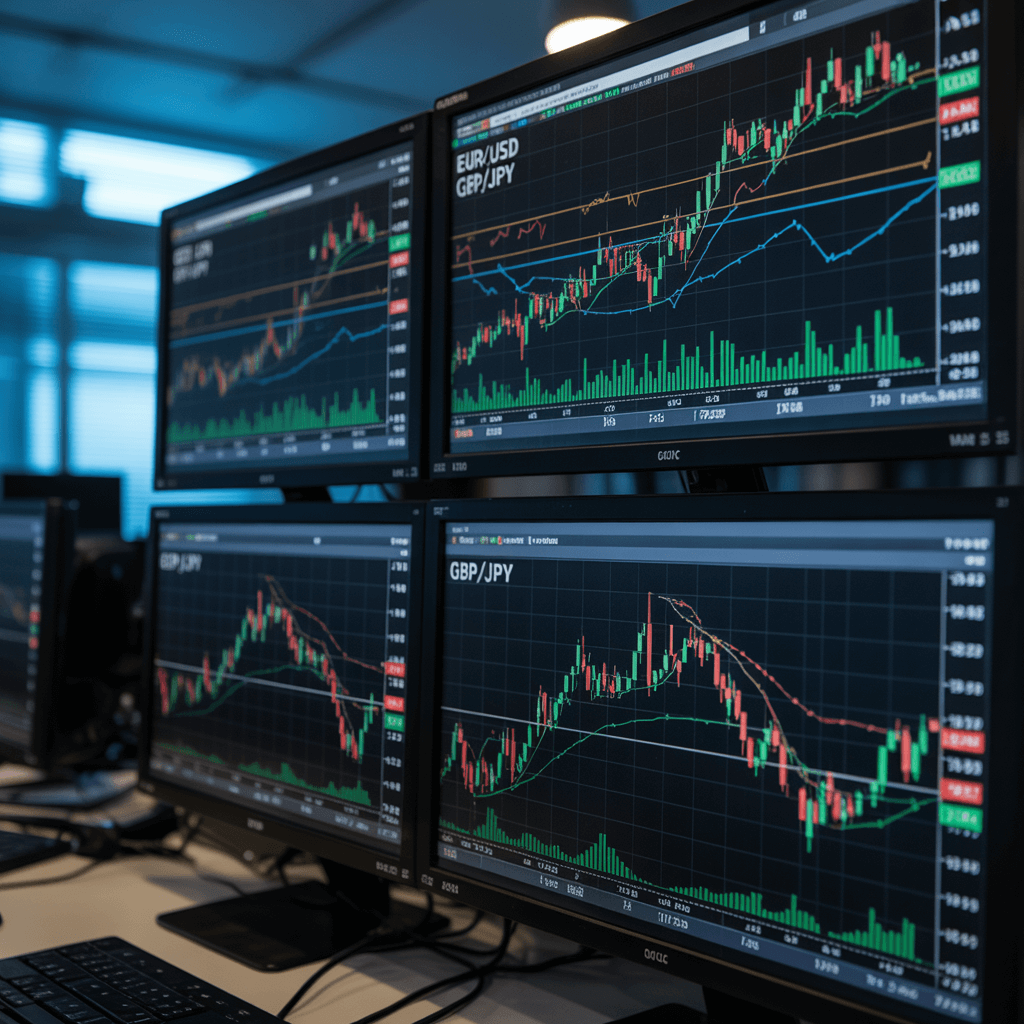
We specialize in developing mobile applications with sophisticated financial data visualization, interactive charts, candlestick patterns, and real-time market analytics. Our team creates powerful tools for financial analysis and market insights through cutting-edge mobile technology.
We offer comprehensive financial data visualization and mobile analytics solutions tailored to your market needs
Complete mobile application development for financial markets, including iOS and Android platforms with real-time data processing and advanced charting capabilities.
Sophisticated financial chart visualization including candlestick patterns, technical indicators, and interactive market data displays for professional analysis.
Advanced optimization techniques to ensure smooth real-time market data streaming across all devices with minimal latency and maximum accuracy.
Expert integration with financial data providers, market feeds, and trading platforms including custom solutions for your specific market requirements.
Comprehensive market analysis tools and data visualization strategies to maximize your financial insights and market understanding.
Ongoing technical support and maintenance to ensure your financial applications run smoothly and stay updated with the latest market data requirements.
Explore some of our successful financial data visualization and market analytics applications
Advanced financial charting application with real-time candlestick patterns and technical indicators.
Real-time cryptocurrency market analysis with interactive charts and price alerts.
Comprehensive stock market analysis platform with advanced pattern recognition and market insights.
Professional forex market visualization with multiple timeframe analysis and currency pair tracking.
Ready to develop your financial data visualization solution? Contact our team of experts to discuss your market analytics requirements and get started on your financial application journey.
Find answers to common questions about our financial data visualization and market analytics services
We develop financial applications for both iOS and Android platforms, ensuring compatibility across all major devices and operating systems with real-time data processing capabilities.
Development time varies based on complexity, but typically ranges from 3-12 months depending on chart features, real-time data requirements, and market analysis capabilities.
Yes, we offer comprehensive post-launch support including data feed updates, chart optimization, performance monitoring, and ongoing maintenance services.
We integrate with major financial data providers, market feeds, and trading platforms, as well as custom solutions tailored to your specific market data requirements.
Absolutely! We provide advanced candlestick pattern recognition, technical indicators, and market analysis tools to maximize your financial insights and market understanding.